About 18th Digitech
 Awards and Credentials
 Our Partners
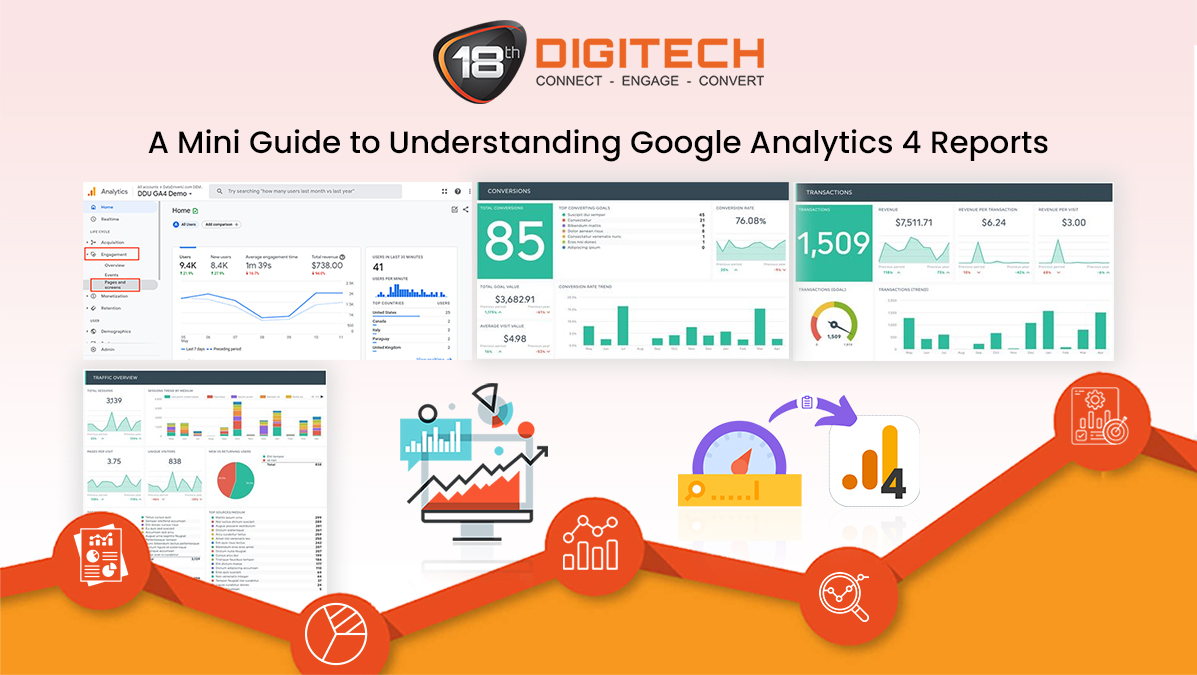
Data collection in Google Analytics 4 is about to witness a new, forward-thinking approach wherein user privacy and tracking user behaviour across the web have become challenging for digital marketers and website owners. Google Analytics 4 (GA4) was therefore introduced to simplify reporting and used advanced machine learning to create a single user story that both website owners and marketers can use. The Google Analytics 4 (GA4) platform uses an easy-to-read dashboard, pre-built reports, and custom reporting capabilities for you the view important data.
In this blog, we have discussed reports in Google Analytics 4 (GA4) to give you an overview of the concept.
But first, let’s get an overview of
Google Analytics 4
A successor of Universal Analytics, Google Analytics 4 (GA4), and the latest version of Google’s web analytics platform was launched in October 2020. Designed to provide an advanced and flexible way to track user behaviour across websites, mobile applications, and other digital platforms, Google Analytics 4(GA4) comes with upgraded features like better machine learning insights, cross-device tracking, and better privacy controls. The way data is organised and reported is the key difference between GA4 and Universal Analytics; wherein Google Analytics 4(GA4) uses an event-based model to track user interactions. This helps more granular tracking and analysis of user behaviour.
Google Analytics 4: Reports
Standard Reports
You’ll locate the standard Google Analytics 4 reports on the left-hand navigation. These pre-built reports deliver data in the form of attractive summary cards and are used to understand user trends or discrepancies promptly. Even though Universal Analytics have easily consumable data like Google Analytics 4, reporting in Google Analytics 4 is comparatively cleaner and has default report customisations and an enhanced custom report visualisation builder.
To create custom reports in GA4 standard reports can be fundamental. These standard reports are categorised into:
- Life Cycle Collection: Here, data collected is based on the 4 stages of the customer’s journey including acquisition, engagement, monetisation, and retention.
- Acquisition Report: This is one of the essential data that determines where your users, both new and returning, are coming from. Understanding this will allow you to create better marketing campaigns in the future and figure out why your current marketing efforts aren’t functioning at the optimum level. You can even customise this report to compare the data that matters the most in just a click.
- Engagement Report: Since there wasn’t any standard way to measure engagement so far, the engagement report is a boon for digital marketers wherein analysts can use metrics like bounce rates to calculate engagements. You can now measure how users can engage with your website based on events and conversion events.
- Monetisation Report: As the name implies, this report tracks revenue-based events like eCommerce and in-app purchases but to view this data you would have to set up the events. The monetisation report shows details about the revenue you’re generating and their sources; and is a great means to identify user trends that determine the efficacy of your campaigns. At the same time, you can monitor any revenue you wish with monetisation reports.
- Retention Report: The retention report is beneficial in determining the percentage of users who re-visit your website every day in the first 42 days after their first visit. Based on the events, you can determine your valuable customers. Referring to this report, you can understand the duration for which any user engages with your website or app. Also, you can track the returning users who visit your website on their second and eighth day.
- User Collection: This report inculcates demographic and tech data that will help you determine the type of users who are visiting your website.
- Demographic Report: To understand your target audience fully, you need to understand your users better. Through the demographic report, you can check your website viewer’s average age, country, city, language, interests, and gender which will help you study your target audience better and customise your marketing efforts accordingly. However, you need to enable Google Signals in the property settings to see this data.
- Tech Report: This report shows the device (mobile, desktop, or tablet) the viewers are using to engage with your website. It also shows the method your users use to access your content. Gaining this insight will help you optimise your content and plan future implementations as per users’ preferences.
- App Developer Collection: Under all developer collections, there are two reports- games reports and firebase reports which are applicable to only those websites that have a connected app.
- Games Report: This report is designed particularly for mobile gaming apps and shares information about how users are engaging with your gaming apps. These reports help in determining how to acquire users and entice them to return, generating revenue for you.
- Firebase Report: This app development software is used to create iOS, Android, and Web apps and shows the key metrics of apps that are connected to firebase. Firebase report also includes data about users and their behaviours.
Real-time Reports
Referring to real-time reports, you can monitor your app and website activity in real time. Data here is available in an easy-to-read format and has supporting visuals containing information such as
- The total number of users that visited your website in the past 30 minutes.
- Where these visitors are coming from.
- Your users and audience
- The type of content that keeps them engaged with your website.
- The events they trigger and the conversions they make.
While Google Analytics 4 and Universal Analytics both provide real time reporting, there are more interactive visuals in Google Analytics 4 that can help you dive deep into event triggers. At the same time, you can have an idea of data using cards with Google Analytics 4 that can help you navigate data from one main viewpoint easily.
Custom Reports
Unlike the 78 standard reports that Universal Analytics provides, Google Analytics 4 comes with 19. Since one of the major concerns was losing familiar reports and losing valuable data, significant improvements were made to allow this reduction. Due to these enhancements, marketers have made better customisation capabilities, reporting cards, and the Explore custom reports builder that can either supplement missing reports or create new ones.
Wrapping Up,
For comprehensive insights into Google Analytics 4 reports and its latest features, reach out to our expert team at 18th DigiTech, a leading marketing agency. We specialize in seamless migration and offer personalized walkthroughs tailored to your needs.